Time to be Aggressive?
The U.S. stock market capitalization is now just 65% of GDP, and stocks are trading around 10 times normal earnings. That is, stocks’ earnings yield is 10%. The current dividend yield is 3.6%, higher than the 3.2% on the ten-year Treasury note. On an absolute basis, the last time we saw these prices on the S&P 500 Index was in April 1997. But to find these valuation levels, one would have to go back to the mid-1980s. Yes, the economy is weakening significantly and will be very difficult for quite some time. And stock prices will probably still go lower, perhaps meaningfully so. But stocks are discounting a very difficult economic scenario already, and investors at current levels should do very, very well from here. As Warren Buffett recently wrote, "If you wait for the robins, spring will be over."
The State of the Stock Market
On the New York Stock Exchange:
New 52-week highs: 13
New 52-week lows: 1,813
Of the 52-week highs, 12 of them are Inverse funds. Take from this what you will.
New 52-week highs: 13
New 52-week lows: 1,813
Of the 52-week highs, 12 of them are Inverse funds. Take from this what you will.
Indiscriminate Selling Continues to Bring Expected Returns Higher
The world sure seems bleak right now. At least that's what the media is intent on conveying, as it produces an almost endless stream of bad news – home prices falling, food and gas prices rising out of control, stocks (and 401k balances) down significantly amid an uncertain and fragile economic situation. What is lost in the noise, however, is that our economy is in good fundamental shape. Because most people still have jobs, they largely continue to pay their mortgages despite fears of widespread defaults. True, some areas have been hit especially hard by problems in the housing market. But this is not the entire country! The average consumer is pretty well leveraged, and may realize that ratcheting back spending is a good idea, even though it may be painful to do so. Consumers ratcheting back their spending will affect the unemployment rate as the most discretionary items are cut from household budgets (especially as more people start to budget). Yet the situation we're seeing now is not really anything new.
While the widespread problems in the housing market are a relatively new phenomenon, it is just a different version of problems we have experienced in the past. This time it is the real estate market, last time it was Internet stocks, in the early 1980s with was runaway inflation. All brought stock prices down to levels that would, years later, look like a bargain. It is my contention that this time is no different. Like a B movie, the specifics may have changed, but the basic story is about the same.
What we won’t hear much about is the incredible opportunities available to investors right now. Home prices are lower, yes. But for those with available purchasing power, very good income-producing real estate is available at lower and lower prices. Cap rates (the assumed rate of return on property based on net operating income) are rising across the country as many of the former sources of financing with loose lending terms have shut down. Stock prices are now more than 20% below their highs of last year. Many of the world’s finest companies are selling at low multiples to long-term free cash flows. The time to invest new money is now. Asset prices may continue to get cheaper in the short-to-intermediate term, but those who have the courage of their convictions and invest now might just look like geniuses five years hence.


The difference is striking. Falling stocks prices have added about a cumulative 34% (3% annually) to the possible ten year returns from stocks. That is, a person investing now stands to earn an incremental 3% annually versus another person investing at the October highs - regardless of what the market does over the next ten years!
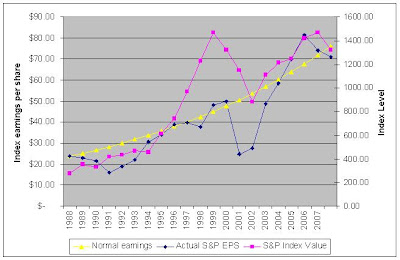
Over the long-term, stocks track earnings. The above chart show the last twenty years (1998-2008) of actual earnings, normal, or trend, earnings, and stock prices. The normal earnings line is the trend line, because it assumes earnings grow 6% annually without any volatility. The actual S&P earnings per share has tracked this line over time, and although it has diverged meaningfully at points, it has always seemed to tend back to it after diverging. Stock prices also track this trend, excluding the irrationally exuberant period of the late 1990s. Betting on stocks is a bet on future earnings. So if you believe that over the longer-term our economy will perform about as it has in the past, stock appear to offer reasonable returns from these levels. But these levels also appear to offer excellent opportunities to buy individual stocks that will perform significantly better than the overall market in the years to come.
While the widespread problems in the housing market are a relatively new phenomenon, it is just a different version of problems we have experienced in the past. This time it is the real estate market, last time it was Internet stocks, in the early 1980s with was runaway inflation. All brought stock prices down to levels that would, years later, look like a bargain. It is my contention that this time is no different. Like a B movie, the specifics may have changed, but the basic story is about the same.
What we won’t hear much about is the incredible opportunities available to investors right now. Home prices are lower, yes. But for those with available purchasing power, very good income-producing real estate is available at lower and lower prices. Cap rates (the assumed rate of return on property based on net operating income) are rising across the country as many of the former sources of financing with loose lending terms have shut down. Stock prices are now more than 20% below their highs of last year. Many of the world’s finest companies are selling at low multiples to long-term free cash flows. The time to invest new money is now. Asset prices may continue to get cheaper in the short-to-intermediate term, but those who have the courage of their convictions and invest now might just look like geniuses five years hence.
Amid all the uncertainty, what can we expect the stock market to look like in 10 years? I ran a few numbers, assuming different scenarios (none of which might illustrate what will actually happen, mind you) but using the same basic underlying idea. I’m assuming that earnings in the future continue to grow at about 6%, or the long-term trend rate. I then made separate lines of assumptions – that ending price-to-earnings ratios are 15, 20, and 25 ten years from now. Given these assumptions, what can we expect for returns from current market levels? The table below illustrates.
If P/Es stay about where they are, or 20 times earnings, we might expect annual returns of around 10% annually including dividends. If P/Es decline to 15, this number drops to 7.5%. At 25, we can expect annual returns of 13%, but when stocks have hit a P/E of 25 they have usually not stayed there for long. In addition to the above, I made another assumption not listed on the chart; that is an ending P/E of 10. In this scenario, stocks should return only a cumulative 10.9% over ten years, or 1% compounded annually, for a total return of 3.3% annually from current market levels. The only way I see us getting to a P/E of 10 is in a highly inflationary environment like the early 80s and/or one where the economy is stagnant. Which scenario ends up being close to the actual result is anyone's guess.
Lower valuations generate higher future returns despite the short term pain. The table below illustrates what these same numbers would have looked like from the highs of October 2007, when the S&P closed at 1,565.
The difference is striking. Falling stocks prices have added about a cumulative 34% (3% annually) to the possible ten year returns from stocks. That is, a person investing now stands to earn an incremental 3% annually versus another person investing at the October highs - regardless of what the market does over the next ten years!
Over the long-term, stocks track earnings. The above chart show the last twenty years (1998-2008) of actual earnings, normal, or trend, earnings, and stock prices. The normal earnings line is the trend line, because it assumes earnings grow 6% annually without any volatility. The actual S&P earnings per share has tracked this line over time, and although it has diverged meaningfully at points, it has always seemed to tend back to it after diverging. Stock prices also track this trend, excluding the irrationally exuberant period of the late 1990s. Betting on stocks is a bet on future earnings. So if you believe that over the longer-term our economy will perform about as it has in the past, stock appear to offer reasonable returns from these levels. But these levels also appear to offer excellent opportunities to buy individual stocks that will perform significantly better than the overall market in the years to come.
Ethanol Blend or Regular?
Is it better to fill up with regular gas or with discounted (and subsidized) ethanol blended fuel? In Iowa, for instance, it is ten cents cheaper to fill up with ethanol blend than to buy regular. It looks pretty tempting when filling up to spend less per gallon, but does the discount make it worthwhile?
The National Highway Traffic Safety Administration data show that ethanol has 75,670 british thermal units (BTUs) per gallon instead of 115,400 for gasoline. What this means is that with ethanol, one has to burn more fuel to generate the same amount of energy – 1.53 gallons to be exact. So ethanol has 35% (34.43% to be more exact) less energy per gallon than does regular gasoline. One would expect, then, that filling up with E85, which has a combined 81,629.5 BTUs, would achieve 29% fewer miles per gallon than straight gas. This works about about right. In a recent test by Consumer Reports on a Tahoe, the fuel economy dropped 27% when running on E85 compared with gasoline (from 14 mpg overall to 10 mpg (rounded to the nearest mpg). So using BTUs for the calculations seems reasonable.
So now let’s look at it from the perspective of a person filling up in a state with subsidized ethanol blend available widely. The ten cent discount comes with 90% gasoline/10% ethanol blend. Given this blend, we can expect 3.5% fewer miles per gallon. So in order to justify the price, one would expect the discount on blended fuel from regular gasoline to be more than 3.5% (otherwise we’d pay more on an energy-equivalent basis to use ethanol). That doesn't happen to be the case today.
With gas at about $3.60 and blend at $3.50, that’s only a 2.8% discount in price. (The higher gas prices go the smaller that ten cent price discount will be on a percentage basis.) If we assume the 3.5% less mileage is a good number, the breakeven price (where we should be indifferent between the two) is $2.86 for regular, $2.76 for blend. We’re definitely above that. For E85, prices should be 29% cheaper, or $2.56, for a fuel purchaser to be indifferent between the two alternatives. The last I saw, it was about $2.90.
Just some fuel for thought.
Full disclosure: I’m filling up with regular. I’ll take a look again when (if) prices fall to $2.86 or the price discount widens.
Credit Problems in Perspective
With all of today’s seemingly dire newspaper headlines, sometimes it is difficult to keep things in perspective. Consider, for instance, the current “credit crunch,” including mortgage-related write-downs and credit losses and their effect on financial institutions globally. Through April 1, over 45 of the world’s biggest banks and securities brokerage firms have announced a total of over $230 billion in asset write-downs and credit losses, according to Bloomberg.
This is certainly a very large number, but let's view it in context. It is just 0.4% of the $57.7 trillion U.S. household net worth and less than 2% of our annual gross domestic product. In addition, only $26 billion of this is actual realized losses. In other words, over $200 billion has been due to valuation changes in the securities, whose underlying assumptions may or may not accurately reflect the eventual economic reality that will transpire. If losses actually turn out to be less than is implied by these valuations, we could see “write-ups” and/or higher returns on equity in future periods (owing to the smaller capital base caused by asset-writedowns) . But, of course, losses could also be larger than expected...
This is certainly a very large number, but let's view it in context. It is just 0.4% of the $57.7 trillion U.S. household net worth and less than 2% of our annual gross domestic product. In addition, only $26 billion of this is actual realized losses. In other words, over $200 billion has been due to valuation changes in the securities, whose underlying assumptions may or may not accurately reflect the eventual economic reality that will transpire. If losses actually turn out to be less than is implied by these valuations, we could see “write-ups” and/or higher returns on equity in future periods (owing to the smaller capital base caused by asset-writedowns) . But, of course, losses could also be larger than expected...
2008: A Disjointed Market
As I did last year, I wanted to set forth my views on the markets as we head into a new year. Again, I offer the caveat that predictions, in general, are worthless. The future is necessarily unpredictable. This doesn’t stop people from predicting that, for instance, the S&P 500 will end the year at 1,650 or that oil will top $150. I take a more measured approach, preferring to indicate ranges of possibilities rather than precise estimates. Note that I don’t trade based solely on these macro viewpoints, as I prefer to concentrate on individual names.
Let’s first consider what I said last year: I said I liked two of the Dow’s worst 2006 performers, a statement which is still true (though there are much better bargains out there than these). In fact, I like them even more than last year (since they're cheaper), as Home Depot (HD)was the Dow’s second-largest decliner [after Citigroup (C)]. Wal-Mart (WMT) stayed about where it was at the end of 2006, but business value grew more than its stock price. I said domestic markets may do better than developed international markets. This was partially right: the MSCI EAFE was up 11.2% on the year in dollar terms, but only 3.5% in local currency terms. The S&P 500’s 5.5% gain bested the EAFE’s apples-to-apples return. But the dollar continued to decline (and help international investor returns) while I expected it to rise.
I still believe the dollar is due to rise. On a purchasing power parity basis against major currencies, the dollar is probably 10-30% undervalued. Of course, over long periods currency fluctuations even out, but the dollar has added to returns substantially over the past five years, and I don’t think that trend should be extrapolated too far into the future. Add that to the popular sentiment against the dollar – virtually all of it negative. Add also that a to-remain-nameless supermodel announced publicly that she no longer wants to be paid in dollars. When the least knowledgeable person or group appears, through the lens of popular sentiment, to be making a brilliant decision, it may be time to take a fresh look at the alternate scenario. I now believe it prudent to hedge back to the dollar, if possible. Several very good mutual funds, recently reopened, hedge their currency exposure.
Where is the stock market today? The spread between the forward earnings yield on stocks and the yield on 10-year Treasuries is about 1.6% at today’s levels. As I’ve mentioned in a previous post, this spread has averaged 0.4% but has varied between –4% and +7% over that time period as well. At this point, I would rather have my money in stocks than in Treasuries.
The worst performing sectors in 2007, Financials (down 20.8%) and Consumer Discretionary (down 14.3%), look to be the leaders over the next few years. Financial stocks look the cheapest and thus the most likely to rise from current levels. In addition, many of these stocks trade below book or at historically low premiums to book. Several consumer discretionary stocks, this year’s second-worst performing sector in the S&P 500, also look to be better performers in the year-ahead. Homebuilders may have a little farther to fall, but the risk-reward tradeoff is very favorable from here. I looked at one homebuilder recently that is generating a 25% free cash flow yield. Several REITs have been caught in the "financials" mess and now trade below book value while paying hefty dividends. I look to the beaten-down areas for future standout performers. I am choosing to stay away from some of the Nasdaq's best performers such as Amazon (AMZN), Apple (AAPL), and Research in Motion (RIMM), which were up 139%, and 137% and 165%, respectively, in 2007. These stocks seem too popular to be cheap.
Utilities are probably priced too expensively for their fundamentals. Consider that the utilities sector has risen 121% in the past five years and is the second best performing sector in the S&P 500 over that period, after Energy, which is up 230% over that same timeframe. Consumer Discretionary, Health Care, and Financials, by contrast, are the worst performing, up 42%, 33%, and 32%, respectively, over the past five years. Continuing to bet on Energy, Utilities, and Materials seems to me to be more a bet on hope than on fundamentals. I could be wrong, but it is not within my circle of competence to project from where such high future returns will come.
The market, for the first time in a couple years, is quite disjointed. In 2004, 2005, 2006, the worst performing and top-performing sector were all positive and the spread between best and worst was between 34% and 16%. We had a pretty homogenous, steady march upward. In 2007 that changed, as the spread between the best performing (Energy) and worst performing (Financials) was 53%, with Energy up 32% and Financials down 21%. In such disjointed markets, it is likely that the best performing are expensive, the worst performing are cheap, or both (think technology in 1998-2000). In this case, I’d much rather dive into very cheap financials than ride energy and materials stocks on the hope that commodity prices continue to rise.
I, nor anyone else, can know for sure if a recession is coming. To be honest, I wouldn’t be surprised if one is already here, a feeling I get after reading third quarter earnings reports and listening to company conference calls. Jobs data, as a lagging indicator, has not yet declined to reflect this, and unemployment is still at a level many consider “full.” Two sectors – financials and consumer discretionary – probably already reflect recessionary conditions and thus stocks in these sectors should be hurt less by an actual downturn. The sectors that will really be hurt by a recession are precisely 2007’s winners – energy, materials, utilities and industrials. While utility companies will be okay, their stocks look to be pricing in uninterrupted, strong global growth.
In 2006, oil prices were essentially flat. This year they rose almost 30%. I think in 2008 we’ll average the year at a lower price that where we began. This is especially true if the worldwide economy really slows down. I don’t have any special insight into the marginal cost of production of a barrel of oil, but some very credible sources lead me to believe it’s now over $50 but under $70 per barrel (which is quite a bit higher than I thought last year). So somewhere in that range doesn’t seem like a bad place to consider as a fair price for oil. Regardless of the oil price fluctuations, I would like to see some of these oil companies trading at a 6 times earnings like we saw in mid-2006 again in 2008. But we’ll have to see if I get my wish.
What I am worried about is inflation and a lot of others are too (gold was up substantially in 2007, as were TIPS). Nevertheless, I think is healthy to worry about it because it is an ever-present threat to wealth. From what I’ve read, inflation (as measured by the CPI) if calculated the old way, would be substantially higher than at present (8-10% versus just 2-4%). This is not hard to believe. I see higher prices or similar prices but smaller packages (stealth inflation) almost everywhere I shop. Food price inflation is rampant in fast-growing countries like China and in the U.S.. I’m sure the artificial (read: subsidies necessary to survive) market for ethanol is playing a role here. I must note that deflation continues in certain areas, such as consumer electronics. Why worry about inflation? Higher (especially higher than expected) inflation means higher interest rates which leads to higher bond yields (lower prices) and may hurt stock market values. Companies with pricing power will be the best positioned. Also, real estate values tend to rise with inflation though it pays to be selective here.
Well, I’m sure I could write several more paragraphs on what I’m currently thinking but I’ll cut it off here. These are some overarching views on the year ahead. As usual, it is bound to be interesting. If your investments get cheaper and nothing fundamental has changed, buy more! Be greedy when others are fearful and fearful when others are greedy. Happy investing in 2008.
Disclosure: Long shares of C, HD, WMT.
Subscribe to:
Posts (Atom)